Recent searches
Search options

#rprogramming
1 post1 participant1 post today


New version of R is out!
Our Data Scientist, Russ Hyde, has put together a quick review of the key features and changes in R 4.5 — from new language features to graphics updates and more.
 Read the full blog post here: https://www.jumpingrivers.com/blog/whats-new-r45/
#rstats #update #Rprogramming #datascience #opensource
https://www.jumpingrivers.com/blog/whats-new-r45/

www.jumpingrivers.com · What's new in R 4.5.0?Here we summarise some of the more interesting changes that have been introduced in R 4.5.0.

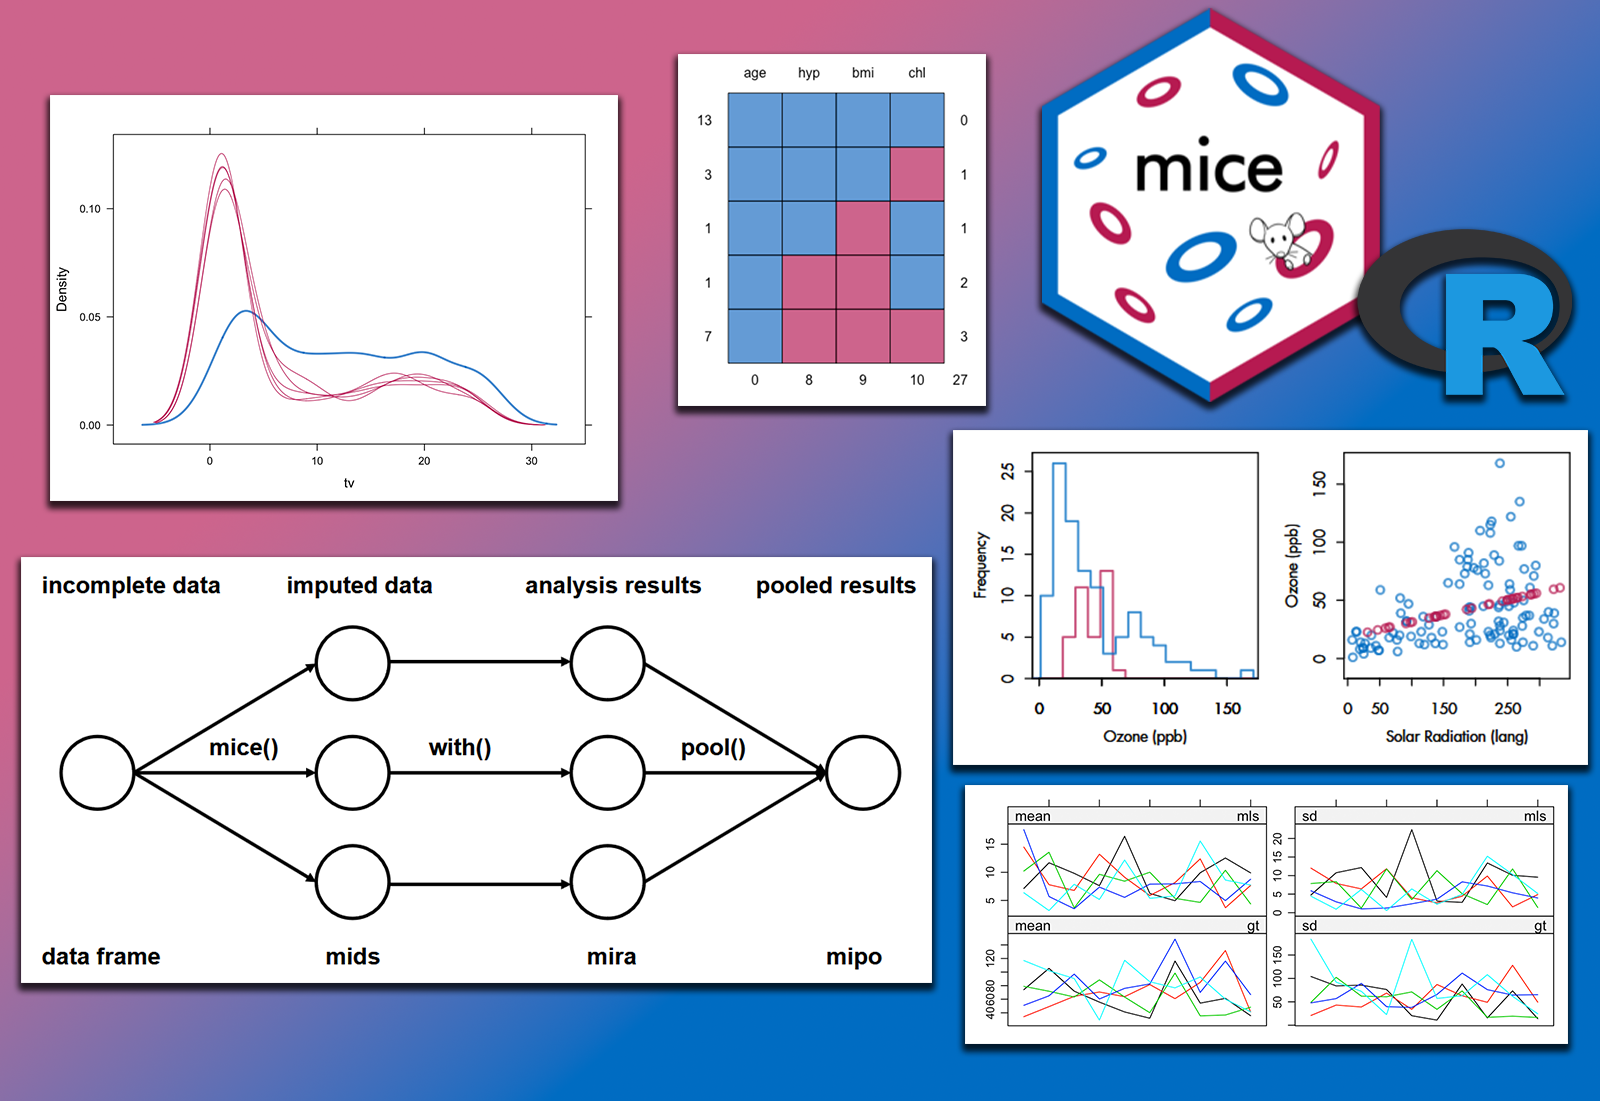
Handling missing data is a critical step in data analysis, as failing to address it properly can lead to biased results and reduced analytical power. The mice package for R, short for Multivariate Imputation by Chained Equations, provides a robust and flexible framework for handling missing values through multiple imputation.
The visualizations shown below originate from the package website: https://github.com/amices/mice
More info: http://eepurl.com/gH6myT
I have hear a link with a bunch of R related material. It is constantly updated:
https://app.dotadda.io/teams/bad2fd50-1971-4103-903a-4c6406e3f445/dots

app.dotadda.ioDoTaddaGain total control of your team's critical project emails, files, and notes.

I have hear a link with a bunch of R related material. It is constantly updated:
https://app.dotadda.io/teams/bad2fd50-1971-4103-903a-4c6406e3f445/dots
app.dotadda.ioDoTaddaGain total control of your team's critical project emails, files, and notes.
 Master while loops in R! Learn how to optimize performance, avoid common pitfalls, and write cleaner code. This guide is perfect for R programmers looking to enhance their skills.
 Check it out: The Complete Guide to While Loops in R here: https://www.spsanderson.com/steveondata/posts/2025-03-31/

Master while loops in R! Learn how to optimize performance, avoid common pitfalls, and write cleaner code. This guide is perfect for R programmers looking to enhance their skills.
Check it out: The Complete Guide to While Loops in R here: https://www.spsanderson.com/steveondata/posts/2025-03-31/


 Bioconductor Kenya Course Kickoff!
  Our first Bioconductor course in Africa started in Nairobi! Day 1 featured learning and collaboration with Laurent Gatto, and Michael Landi. Sessions later this week by Fabricio Almeida-Silva, Laurah Ondari, and Zedias Chikwambi. Thanks to CZI and UL Global for funding.
#Bioconductor #Bioinformatics #RProgramming #Carpentries #Africa


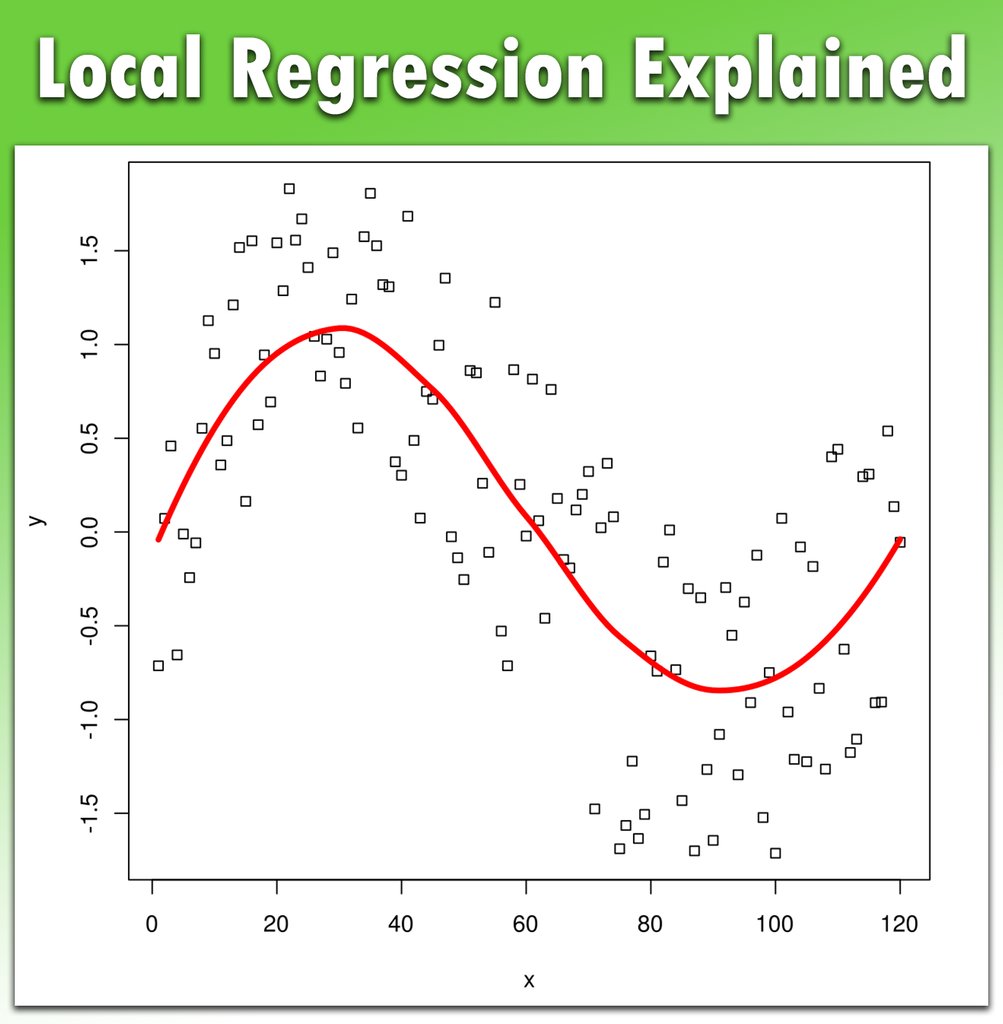
Local regression is a non-parametric method for fitting smooth curves to data by applying multiple localized regressions. It is useful for uncovering non-linear relationships when the data’s exact form is unknown. Proper use of local regression can reveal trends in noisy data, but poor implementation might lead to misleading results.
Image: https://en.wikipedia.org/wiki/Local_regression#/media/File:Loess_curve.svg
More details: http://eepurl.com/gH6myT
 See nested loops in action! I've shared some quasi real-world #RStats examples showing how to handle complex data structures effectively.
Explore the examples  https://www.spsanderson.com/steveondata/posts/2025-03-10/
![# Inefficient approach (without pre-allocation)
result_inefficient <- c()
for (i in 1:1000) {
result_inefficient <- c(result_inefficient, i^2)
}
# Efficient approach (with pre-allocation)
result_efficient <- numeric(1000)
for (i in 1:1000) {
result_efficient[i] <- i^2
}](https://cdn.masto.host/rstatsme/media_attachments/files/114/138/215/551/324/884/original/f44539a8cf5f811c.png "# Inefficient approach (without pre-allocation)
result_inefficient <- c()
for (i in 1:1000) {
result_inefficient <- c(result_inefficient, i^2)
}
# Efficient approach (with pre-allocation)
result_efficient <- numeric(1000)
for (i in 1:1000) {
result_efficient[i] <- i^2
}")
See nested loops in action! I've shared some quasi real-world #RStats examples showing how to handle complex data structures effectively.
Explore the examples https://www.spsanderson.com/steveondata/posts/2025-03-10/
![# Inefficient approach (without pre-allocation)
result_inefficient <- c()
for (i in 1:1000) {
result_inefficient <- c(result_inefficient, i^2)
}
# Efficient approach (with pre-allocation)
result_efficient <- numeric(1000)
for (i in 1:1000) {
result_efficient[i] <- i^2
}](https://media.mstdn.social/media_attachments/files/114/138/215/299/502/980/original/157236e6f1ecf396.png "# Inefficient approach (without pre-allocation)
result_inefficient <- c()
for (i in 1:1000) {
result_inefficient <- c(result_inefficient, i^2)
}
# Efficient approach (with pre-allocation)
result_efficient <- numeric(1000)
for (i in 1:1000) {
result_efficient[i] <- i^2
}")
 Tired of NA values messing up your analysis?
Here are powerful R techniques to handle missing data like a pro: tidyr::drop_na() for quick cleaning
  dplyr::coalesce() for smart replacements
  mice package for imputation Custom functions for complex cases
Check out the full guide! #R #RStats #DataCleaning #Tidy #Stats #Blog #RProgramming #Data

Tired of NA values messing up your analysis?
Here are powerful R techniques to handle missing data like a pro: tidyr::drop_na() for quick cleaning dplyr::coalesce() for smart replacements mice package for imputation Custom functions for complex cases
Check out the full guide! #R #RStats #DataCleaning #Tidy #Stats #Blog #RProgramming #Data

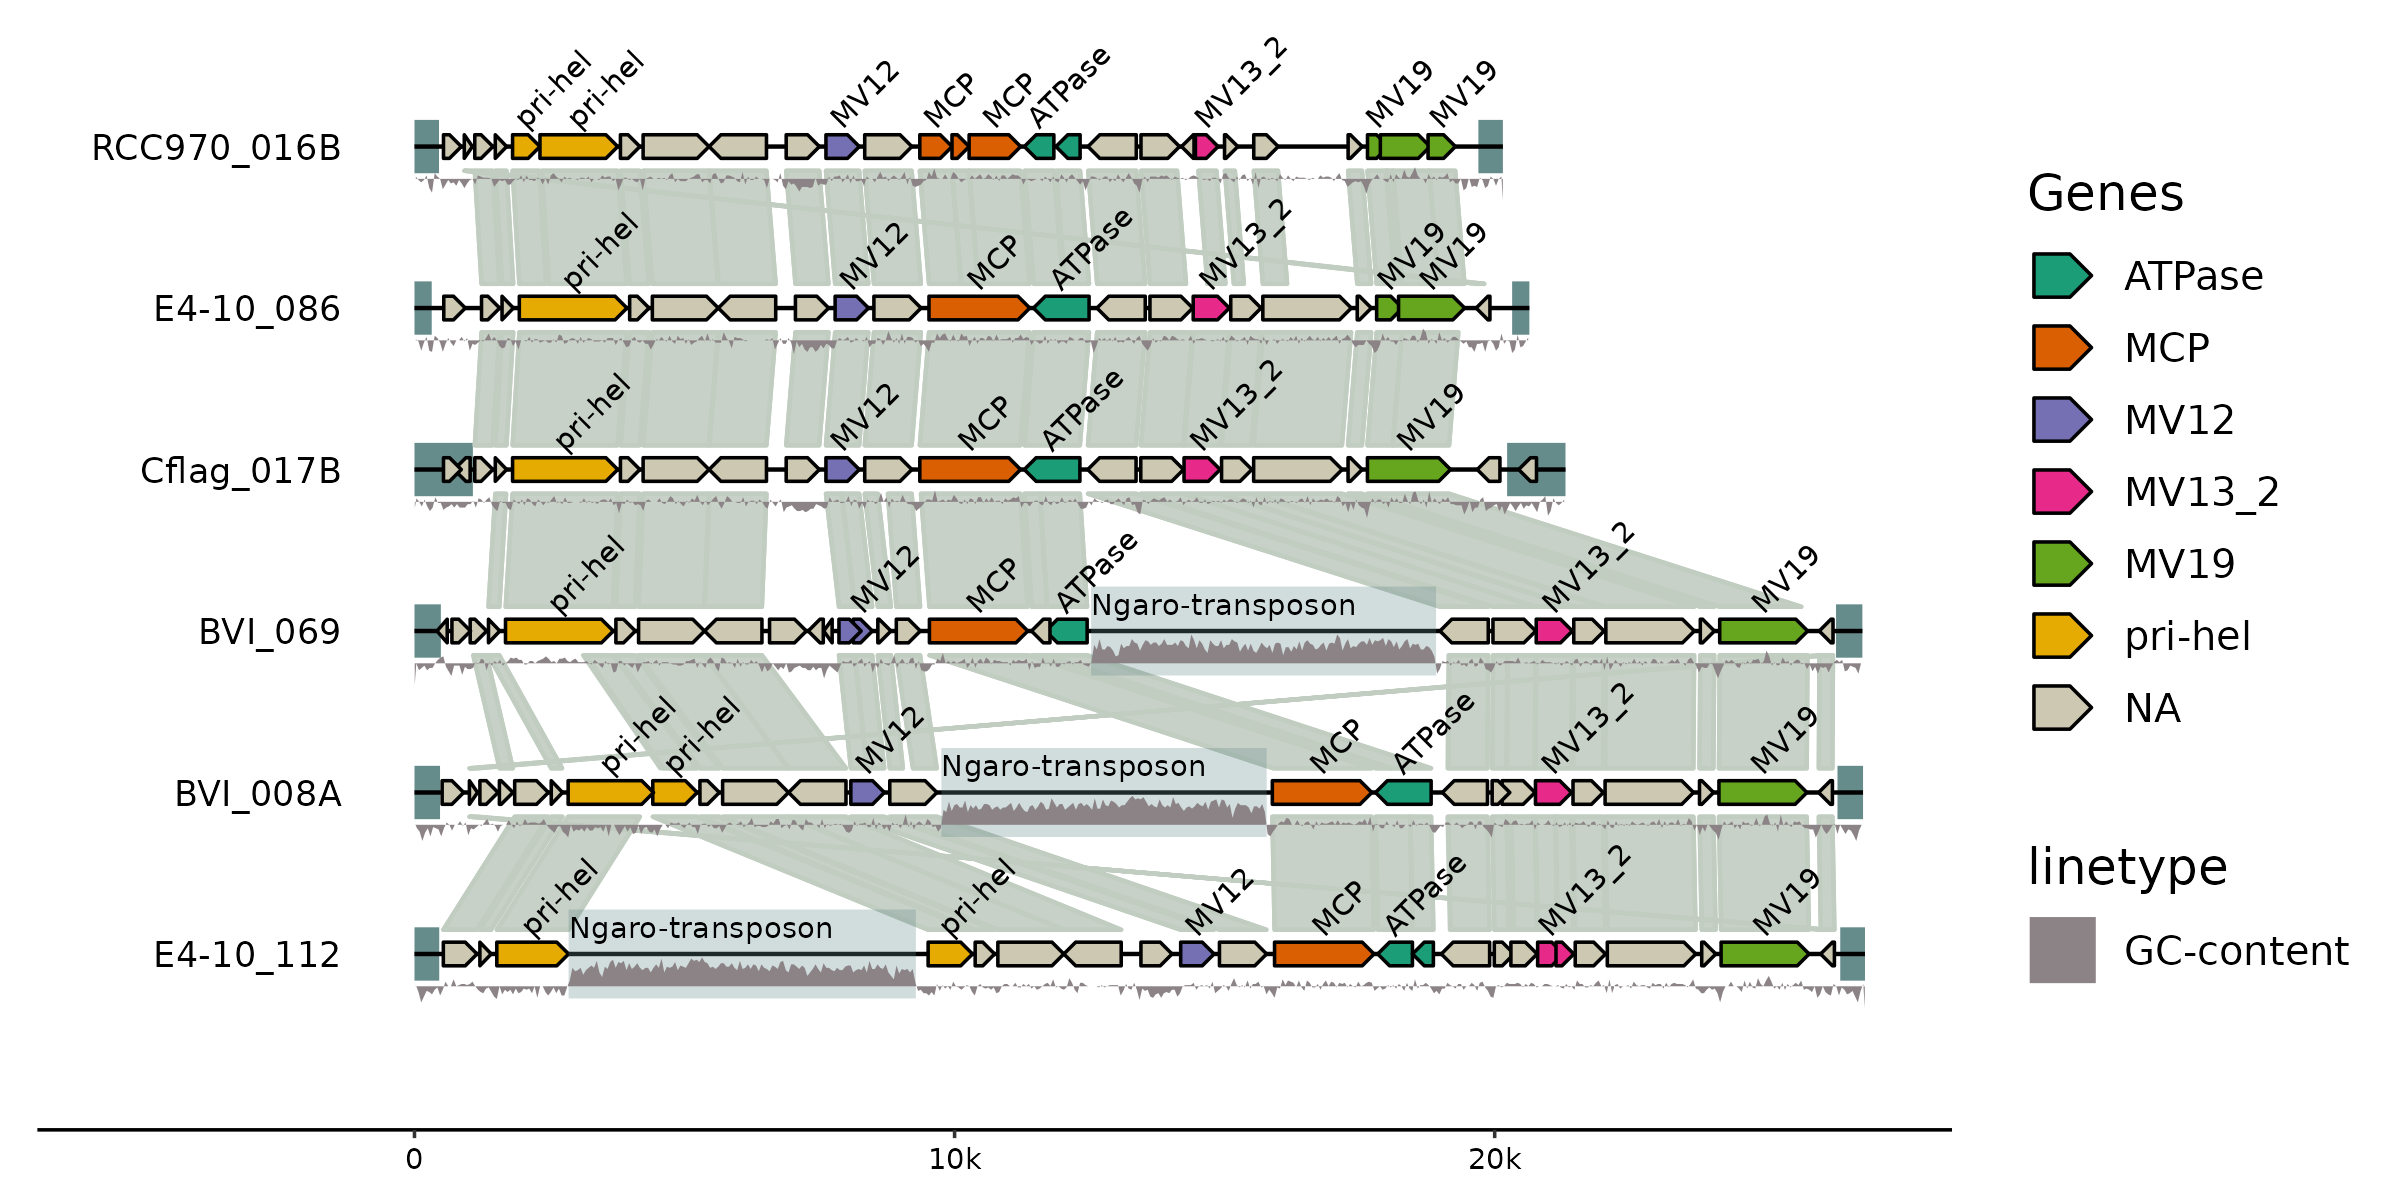
Visualize genomic data with ease using gggenomes, an R package that extends ggplot2 to handle and display genomic information intuitively. Whether you’re comparing genomes, analyzing features, or showcasing synteny, gggenomes provides the tools you need to turn complex genomic data into clear, informative visualizations.
Visualization: https://github.com/thackl/gggenomes
Further details: https://statisticsglobe.com/online-course-data-visualization-ggplot2-r

Connecting R to PostgreSQL: A Guide to Database Interaction
Learn to connect R to your PostgreSQL database for powerful data analysis! This guide covers connections, error handling, data management, and best practices. #RPostgreSQL #DatabaseConnection #DataAnalysis #RProgramming #DB2 #SQL
https://tech-champion.com/database/db2luw/connecting-r-to-postgresql-a-guide-to-database-interaction/
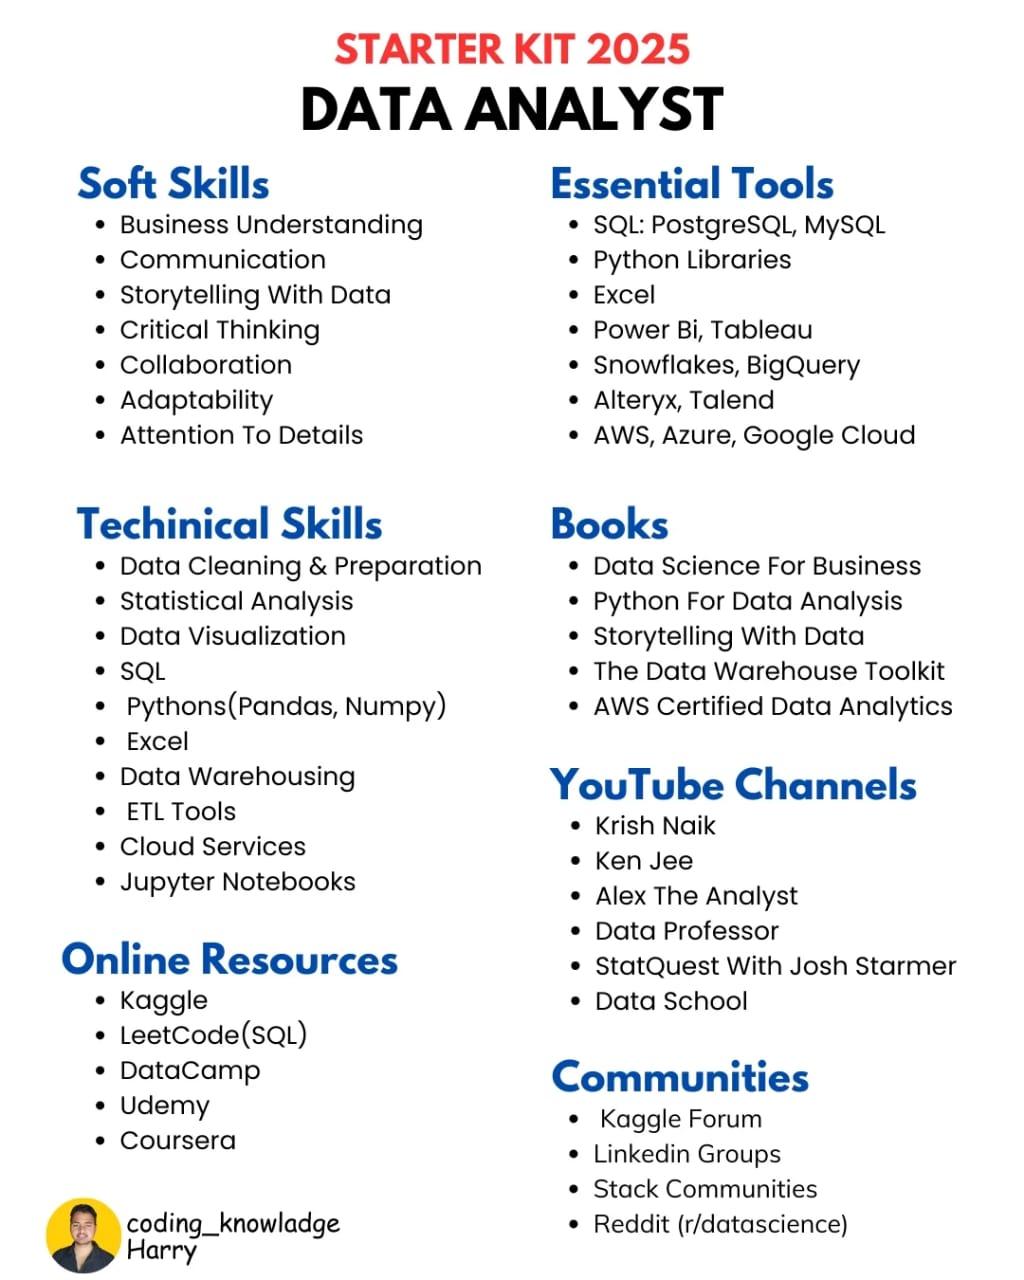
Starter Kit for Data Analysts in 2025
Are you looking to break into the world of data analysis in 2025? Whether you’re just starting out or looking to level up your skills, here’s your ultimate data analyst starter kit to kickstart your career in this high-demand field.
Explore 9 top online courses for mastering data analytics with R in 2025. These courses, rated on effectiveness and student satisfaction, include Datacamp's "Data Analyst with R", Google's "Data Analytics Professional Certificate" on Coursera, and Udacity's free "Data Analysis with R" course. Gain essential skills in data manipulation, visualization, and statistical analysis. #DataAnalytics #RProgramming #OnlineLearning https://www.mltut.com/data-analyst-with-r-online-courses/
MLTut · 9 Best Data Analyst with R Online CoursesDo you want to learn data analytics with R? If yes, then Good Decision! Because R programming has various statistical and graphical capabilities. R has a huge variety of libraries to perform statistical analysis. Some most powerful visualization packages in R are ggplot2, ggvis, googleVis, and rCharts. So, if you are looking for a data analyst with R online courses, then this article will help you.
Earliest Bird tickets have sold out, but no worries Early Bird tickets now available!  Don't miss this #opportunity to be part of a vibrant community of R enthusiasts and experts.
Secure your spot now: https://www.eventbrite.com/e/cascadia-r-conf-2025-tickets-1102521995969

 Less than 24 hours left to submit your proposals for the #CascadiaR #Conference. Don't miss this chance! Submit your 15-min full talks and 5-min lightning talks today at https://cascadiarconf.com/cfp/ The Call for Presentations closes February 14 at 5PM PT.
#DataScience #RProgramming #R #RStats
CascadiaRConfCall for PresentationsCascadia R Conference is an R conference serving the Pacific Northwest region (Alaska/British Columbia/Washington/Oregon/California).
Check out our most recent blog on the {sparkline} package in R from our Data Scientist Osheen Macoscar!
Discover how to create compact, informative inline charts like line graphs, bar charts, and box plots to enhance your data visualisations.
#RStats #DataVisualisation #DataScience #Shiny #RProgramming
www.jumpingrivers.com · Sparkline Package for Inline VisualisationsThis is part one of a multiple part blog series, in which I will be demonstrating how to create inline visualisations using the {sparkline} R package.