Recent searches
Search options
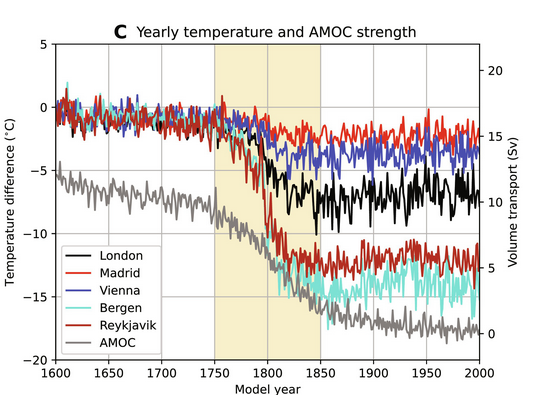
I'm not a scientist, but this is how a simulated collapse of AMOC actually looks like. Source link in second reply.
Right axis = Sv = flow of water
Grey line = AMOC
• 150 years = slow reduction in flow from about 12 to 10 Sv
• 100 years = yellow band = collapse of Amoc. It drops roughly from 10 to 2 Sv
• 150 years = slow reduction to zero flow
(1/3)
#Amoc #ClimateModel #Climate


