Recent searches
Search options
I'm not a scientist, but this is how a simulated collapse of AMOC actually looks like. Source link in second reply.
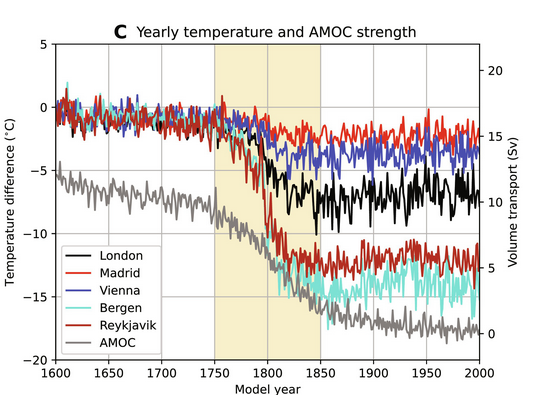
Right axis = Sv = flow of water
Grey line = AMOC
• 150 years = slow reduction in flow from about 12 to 10 Sv
• 100 years = yellow band = collapse of Amoc. It drops roughly from 10 to 2 Sv
• 150 years = slow reduction to zero flow
(1/3)
#Amoc #ClimateModel #Climate
There's a saying in Norway that there isn't any bad weather, just bad clothes.
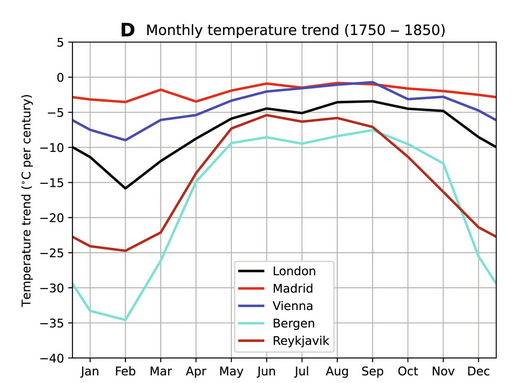
Not for much longer. Temperature in Norway drops faster than they can adapt.
They have like +5 °C in February now. After a collapse they will have -20 to -30 °C during three winter months. Inte sur gå på tur.
Average summer temperatures will be like +5. Norway effectively becomes the new Siberia.
Image source. Both screenshots are from Fig 3.
Article: Physics based early warning signal shows that AMOC is on tipping course
CC BY 4.0 René M. van Westen*, Michael Kliphuis, Henk A. Dijkstra
(3/4) - added a post.
https://www.science.org/doi/10.1126/sciadv.adk1189
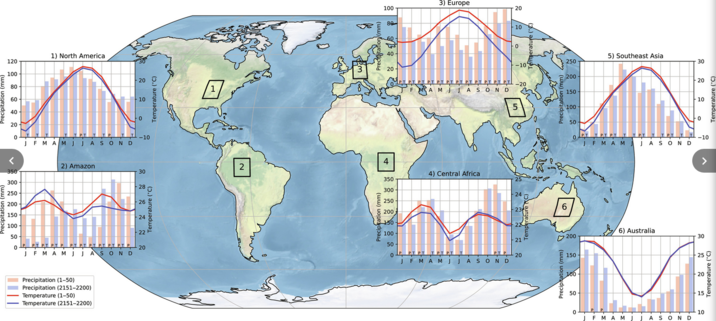
The good news is that it's not the end of the world if AMOC collapses. Just the end of Scandinavia. We would need winter gear and snow mobiles in the summer.
Europe as a whole sees dropped temperatures and drier weather. Several freezing months probably interfere with food production
The rest of the world is okay, except south America.
Chaotically the wet and dry season changes. If that disturb the rain forest the rest of the world could see some serious problems, perhaps.
(4/3)
#Climate
or okay? - I have a feeling that it's a major disaster if the ocean currents stop, but the graphs taken out of context from everything else doesn't look too bad.
Except that a tiny change in average temperature could cause deadly heatwaves or frozen crops. The coral reefs disappear of course. Things like that.
A stopped AMOC doesn't mean guaranteed human extinction. If we can restore the atmosphere during the 100 years of collapse we could potentially mitigate the worst effects.
(5/3)
@JohanEmpa
For anyone skimming this (like me): the years listed are the year in the simulation, not CE.
@JohanEmpa Immodest request - can you save me reading the original article, by telling us what the model year '0' means? Which set of conditions prevails at year 0, is it like the start of industrial age, or today, or what else?
Background of course is: how soon does the projection expect AMOC to collapse, in relation to today?
@markus_quandt They start from a preindustrial control simulation. Then they add freshwater flux and linearly increase it until year 2200. Part of it was to confirm if a tipping event would happen.
They don't try to predict a date. They want to find a method to measure the tipping point before it happens.
They can observe it about 25 years before it happens in the simulation.
@JohanEmpa Thanks, that is a helpful explanation.


