Recent searches
Search options
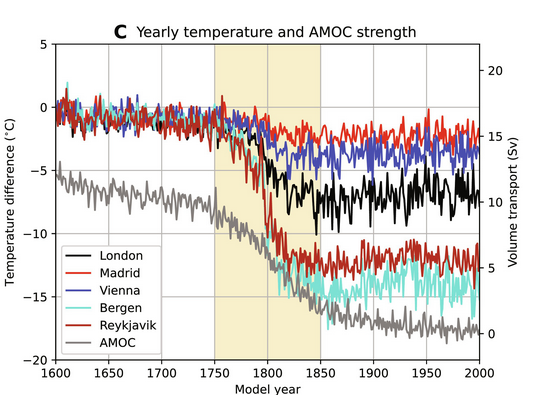
I'm not a scientist, but this is how a simulated collapse of AMOC actually looks like. Source link in second reply.
Right axis = Sv = flow of water
Grey line = AMOC
• 150 years = slow reduction in flow from about 12 to 10 Sv
• 100 years = yellow band = collapse of Amoc. It drops roughly from 10 to 2 Sv
• 150 years = slow reduction to zero flow
(1/3)
#Amoc #ClimateModel #Climate
@JohanEmpa Immodest request - can you save me reading the original article, by telling us what the model year '0' means? Which set of conditions prevails at year 0, is it like the start of industrial age, or today, or what else?
Background of course is: how soon does the projection expect AMOC to collapse, in relation to today?
@markus_quandt They start from a preindustrial control simulation. Then they add freshwater flux and linearly increase it until year 2200. Part of it was to confirm if a tipping event would happen.
They don't try to predict a date. They want to find a method to measure the tipping point before it happens.
They can observe it about 25 years before it happens in the simulation.
@JohanEmpa Thanks, that is a helpful explanation.


